


 73 / 82

73
Annual Report 2014 Our Business ModelRatings awarded to Cecabank
as at 31 December 2014 by
the international agencies Fitch
Ratings, Moody’s and Standard &
Poor’s, are:
Agency Short-term Long-term Outlook
Date
Moody´s
NP
Ba3
Negative
20/11/2014
Fitch
F3
BBB-
Negative
21/11/2014
S&P
A-2
BBB
Stable
27/11/2014
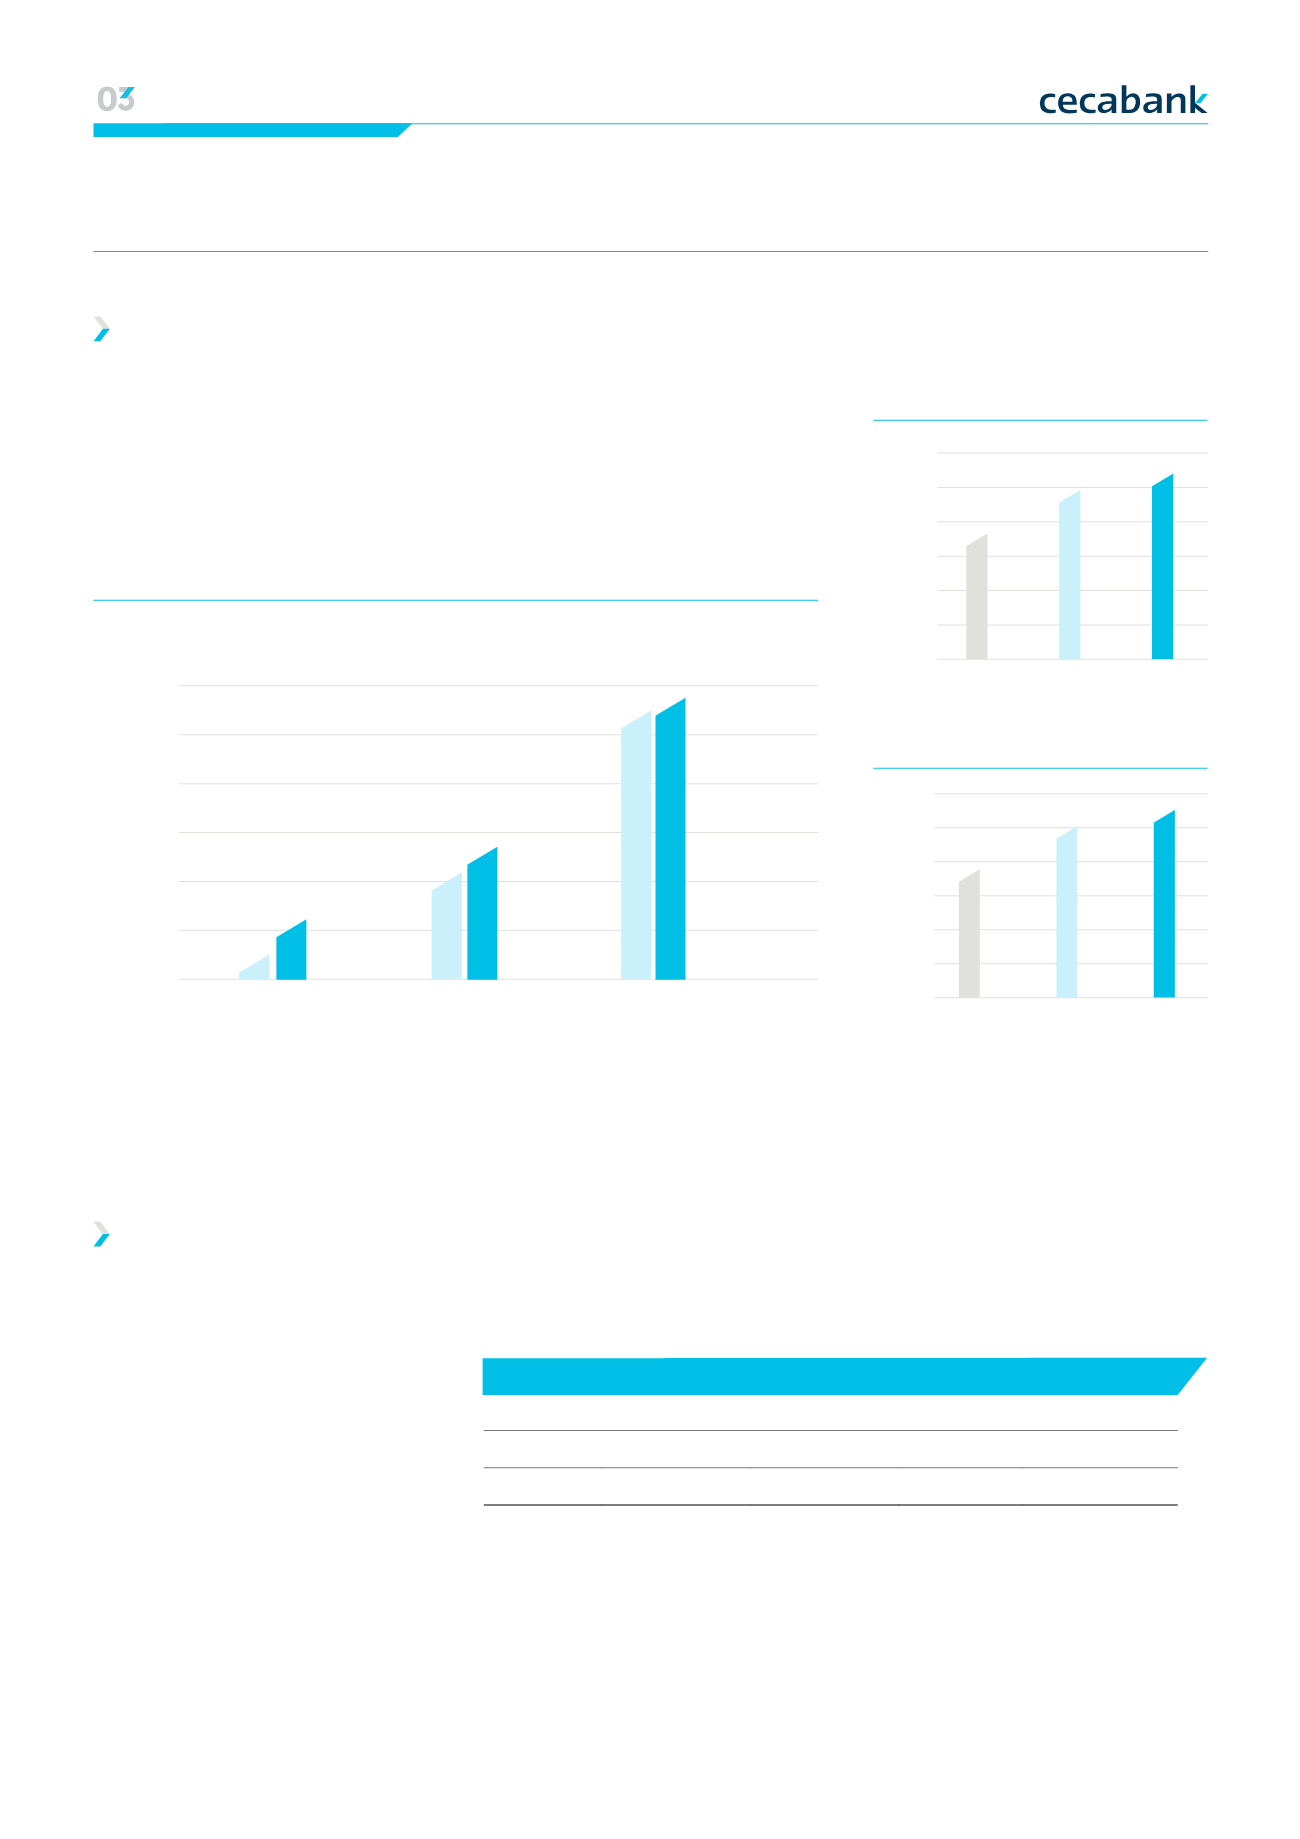
Cecabank has been strengthening its capital base in recent years, which in
conjunction with low levels of risk, has enabled its capital ratios to increase
steadily over time.
2012
700000
740000
780000
800000
760000
720000
680000
2013
2014
TIER 1 CAPITAL
791,021
695,991
727,554
794,896
704,640
734,265
thousands of euros
Tier 1 capital
Total equity
Capital base
Ratings
2012
5,00%
15,00%
25,00%
30,00%
20,00%
10,00%
0,00%
2013
2014
CET 1 RATIO
26.53%
18.36%
24.71%
5,00%
15,00%
25,00%
30,00%
20,00%
10,00%
0,00%
SOLVENCY RATIO
2012
2013
2014
26.66%
18.59%
24.94%
00 Strategic lines | Economic and regulatory context | Strengthening our model|
Business lines 01 Financial information | Profit & loss | Activity | Capital base | Ratings 02 Risk management | The Cecabank risk function